9.10. Python tools for visualization
9.10.1. Data for house visualization
Let’s talk data first.
The data is United States Congressional Voting Records 1984, taken from THe UCI machine learning archive. It is also available in R as data included with the mlbench package. In R, you would do:
> library(mlbench)
> data(HouseVotes84)
The HouseVotes84 data set includes votes for each of the U.S. House of Representatives Congressmen on the 16 key votes identified by the Congressional Quarterly Almanac (CQA).
The CQA contains 16 variables, and consider nine different types of votes represented by three classes: yea (voted for, paired for, announced for), nay (voted against, paired against, announced against) and unknown (voted present, voted present to avoid conflict of interest, did not vote or otherwise make a position known).
The 16 bills voted on are:
handicapped-infants
water-project-cost-sharing
adoption-of-the-budget-resolution
physician-fee-freeze
el-salvador-aid
religious-groups-in-schools
anti-satellite-test-ban
aid-to-nicaraguan-contras
mx-missile
immigration
synfuels-corporation-cutback
education-spending
superfund-right-to-sue
crime
duty-free-exports
export-administration-act-south-africa
9.10.2. Dimensionality reduction
For dimensionality reduction, we are going to use LSI (Latent Semantic Indexing): House members are rows, Votes are columns. So in place of a term/document matrix, we have a member/vote matrix.
9.10.3. The Basic script outline
We do the following:
>>> (R_data, data_sums,row_labels,col_labels) = read_data.read_R_data_file(R_data_file, data_type=str)
>>> matrix = convert_house_data_to_ints (R_data)
First we read in the file. We will look at that code
more closely in a moment. For now, the big picture.
R_data contains the raw data matrix.
Each line looks like this:
1 republican n y n y y y n n n y NA y y y n y
We want to convert this to integers using the following idea:
![\begin{array}[t]{lll@{}l}
y &\rightarrow& &1\\
n &\rightarrow& -&1\\
\text{{\sc na}} &\rightarrow & &0
\end{array}](../_images/math/2a16e60e6835d4dfa0184a7348ba5427ed155a62.png)
The function
convert_house_data_to_ints
converts R_data to int s
using this convention,
leaving out the party affiliation. We’ll use that
information at the very end to help sort our points into two different
bins.
The first row of matrix looks like this:
1>>> matrix[0]
2array([-1.,  1., -1.,  1.,  1.,  1., -1., -1., -1.,  1.,  0.,  1.,  1.,
3      1., -1.,  1.])
This represents a single member of the house based on 16 votes, hence a 16 dimensional representation. We want to reduce this to two dimension so that we can see it:
k = 2
member_reps = make_k_space_term_reps (matrix, k)
Of course all the magic is in the function make_k_space_term_reps, which
produces member_reps. Let’s pass over the magic for now
and focus on what it makes appear: member_reps is 435 x 2 matrix representing
each member of the house with two numbers. The first member looks like this:
>>> member_reps[0]
array([-0.06135958,  0.02517892])
So we have a point on the xy-plane. Next we scatter those points over a two dimensional plot:
 1with open(os.path.join(data_dir, 'republicans.dat'),'w') as repub_ofh:
 2    with open(os.path.join(data_dir, 'democrats.dat'),'w') as demo_ofh:
 3        for r in range(len(member_reps)):
 4            party_affiliation = R_data[r][0]
 5            print party_affiliation, member_reps[r]
 6            if party_affiliation == 'republican':
 7                ofh = repub_ofh
 8            else:
 9                ofh = demo_ofh
10            print >> ofh, '%.5f  %.5f' % (-member_reps[r][0],member_reps[r][1])
In line 10, we insert a minus sign (“-”) before the x coord to rotate the plot around the y axis. The effect is that Democrats end up on the left hand side, and Republicans on the right.
9.10.4. The Basic script in total
1set key left box
2#set samples 50
3set terminal postscript
4set output 'house_data.ps'
5plot 'republicans.dat' with points pointtype 5 pointsize 2 lc rgb "red", 'democrats.dat' with points \
6        pointtype 5 pointsize 2 lc rgb "blue"
These are the basic steps in plotting the data.
9.10.5. The image
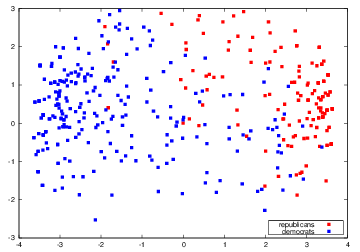
Multidimensional Scaling of vote data from the House using LSI